
Who, what, why?
In 1999 a group of French and Swiss physiologists wanted to find out what would happen to the heart rate variability (HRV) of a group of well trained middle distance runners when their training load was substantially increased over a period of 3 weeks, followed by a reduced load week for tapering.
What did they do?
Seven male elite level middle runners were enrolled for the study, together with eight healthy sedentary control subjects for comparison.
The idea was to increase the training load of the study group significantly in order to produce stress and fatigue levels that would lead to adaptation and increased performance after a taper / de-load week. In other words it was not a deliberate overtraining study (which would be unethical) but was a hard block of intensive training similar to that often employed in a 4 week periodization pattern for elite athletes.
The study group trained between 6 and 10 sessions per week. Training loads were calculated using scores between 1 and 4 depending on the intensity of each session, and fatigue used a subjective 0-10 scale.
HRV and resting HR values were calculated from night time ECG recordings made during the first 4 hrs of sleep. This was before the days of apps and daily measurements, so they used a portable ECG monitor followed by manual screening and analysis of the HRV, using a number of time and frequency domain parameters.
What did they find?
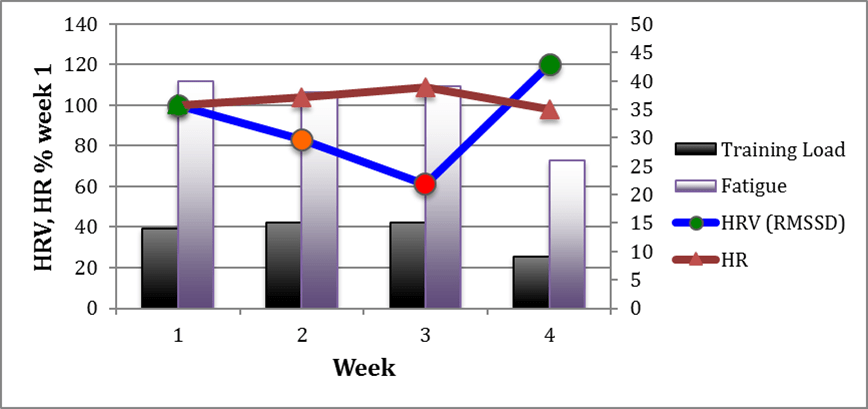
The training load was fairly constant during the 3 week intensive period and reduced by 40% for the last week. The perceived fatigue level followed suit, being 32% lower in the 4th week.
As can be seen in the chart, resting HR of the study group increased slightly during the 3 weeks of intensive training, and decreased below the starting point following the week of tapering.
HRV showed a progressive decrease during the first 3 weeks followed by a marked increase in week 4.
What does it mean?
Taken together, the heart-rate derived parameters behaved in the following way during this training block:
- Resting heart rate increased slightly during the intensive training signalling an accumulation of stress. Resting HR has long been used as an indicator of possible overtraining, but as can be seen in this study, the amounts of change are small and can easily get lost amongst other influences. During the rest week, HR fell below the starting point, which is likely indicating an improvement in aerobic fitness.
- HRV decreased steadily during the intensive training and rebounded during de-load to a higher value than at the start, indicating supercompensation.
The HRV points on the chart are shown in the colours of the ithlete Week Change indication, and show that ithlete would give a progressive warning of overreaching. Whilst many users focus on the Daily Change traffic light, it is very important to take into account the trends reported by both the Week and Month Change indications, as these are the ones that will report an increasing and unsustainable imbalance between stress and recovery. These indicators both take an average of a large number of readings, so they are very reliable.
For ithlete Pro users, the bubble on the Training Guide would have moved further towards the top left during the 3 intensive weeks, then swung back to the right hand side of the recovery axis during the de-load week, reflecting both Daily changes as well as the overall trends.
This is one of the key papers I read (and re-read) when first devising the ithlete colour coded indications in 2008. In retrospect it’s interesting to see how much effort it took these researchers to capture the ECG, manually screen and process the data statistically. This was only 15 years ago, and now the whole test can be done in just over a minute!
Does the graph show the results for all participants in the study? If so, did the outcomes for the elite athletes differ from the sedentary group?
The graph does show the combined results for the participants in the study, all of whom were experienced runners and performed intensified training. The sedentary control group did not perform any physical activity during the study period.
Simon, why does iThlete recommend aerobic training with an amber reading? I have always thought that aerobic (cycling) was more exhausting than weight/strength training and you therefore have more chance of recovery?
Hi Sonya,
Aerobic is used in contrast to anaerobic. Aerobic exercise is continuous but not high intensity, whereas anaerobic & weights are high intensity, even though they may be short duration. Anaerobic exercise activates the sympathetic nervous system and is much more stressful than aerobic. Thats why we recommend aerobic when your body is not well recovered. Dr Phil Maffetone explains the difference much better than I can here:
https://philmaffetone.com/aerobic/