
I just came back after completing the toughest challenge I have undertaken in years – the Haute Route Alps, which is a 7 day road biking stage race from Geneva to Nice with some of the best known Alpine climbs of the Tour de France. 20,000m of ascent over nearly 1000km of racing with 500 dedicated enthusiasts from around the World.
Rather than tell the full story, I wanted to share a couple of interesting observations regarding my HR(V) during training & racing the event itself:
1. Resting heart rate (HR) changes reflect improving fitness better than HRV. As I have described in previous posts, I am a fan of the polarised training model for endurance sports, whereby you spend approx 80% of training time below first ventilatory (lactate) threshold, and the remaining 20% doing High Intensity (HIT) intervals. Since March this year, I have ramped up the volume of training to prepare for the Haute Route, and since mid July, I have been based in France so that I can do 15+ hrs per week of steady climbing in the PreAlps at an easy pace. The chart below shows my HRV & HR (taken in standing position, 7 day moving averages shown), and although the HRV moves between the range of 70-75 without an apparent trend, my resting HR has been falling, especially since beginning the high volume low intensity work in July.
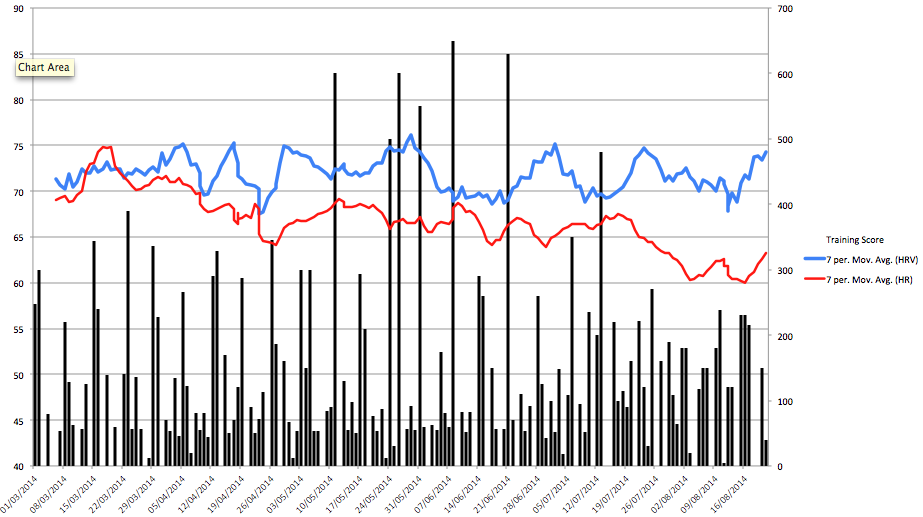
To put this in context, there is a formula sometimes used to estimate VO2 max = 15.2 x HRmax / HRrest so a change over time from 70bpm to 60bpm in resting HR represents a significant 16% improvement in power delivery at the same heart rate. This change ties in well with data captured during my training rides, where I have been riding at constant 145 bpm heart rate, and watching the rate of climb (or VAM) in metres per hour. This is a key metric for endurance cycling uphill, and in my case this figure has improved from about 920 m/hr to 1050 m/hr shortly before the event (a 14% improvement). A possible explanation for the lack of upward trend in HRV is that using HRV to guide training – as soon as HRV increases from one day to the next, we increase the intensity of training and this brings it back down again. It would only be during taper periods that we would expect to see HRV rise beyond normal range – as it starts to do in mid August just before the event.
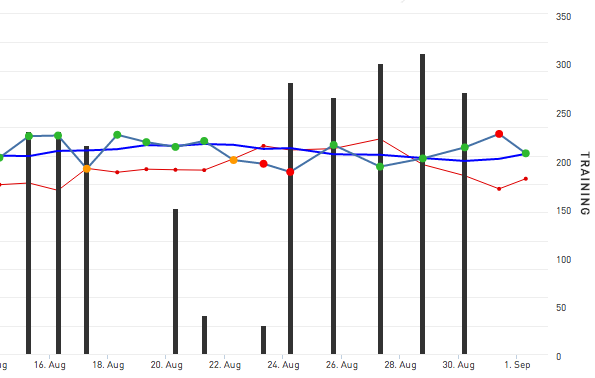
2. HRV decreases are followed by increases as fatigue develops. Referring to the chart below, you can see a significant HRV drop (amber day) on the last of 3 days of hard training on 17th August. Recovery was fast, reflecting a good state of fitness during the taper week until 22nd, which was travel day. Having anticipated the Haute Route challenge for almost a year now, pre-race nerves took over and I had poor HRV morning readings before the short prolog in Geneva and the first proper stage from Geneva to Megeve. By Weds Aug 27th, my HRV was 66, and the weekly change indicator was amber showing cumulative fatigue. Aug 28th was a 180km stage with a very fast rolling 60km finish involving a lot of short intense efforts, and the pattern we see from then onwards is a continuous climb in daily HRV, mirrored by decline in resting HR. By the end of the event it was becoming much harder to raise my effort levels during the race, and this Sunday after completing, I had no energy at all – literally could not walk up stairs. The ithlete daily red indication was spot on here, as the combination of high HRV and low HR were well out of my normal range.
Research has observed this kind of parasympathetic dominant (or Addisonic) overreaching, but explanations are not clear enough yet as to how or why it occurs. Opinions range from adrenal fatigue to blood volume increases, but I know as an athlete that the effects on performance of this state are very limiting.
Another comment I would make is that if you know you are very nervous and / or are doing measurements at a very unusual time in the morning of a race, it might be better to skip the measure that day. It doesn’t help to get an amber if you know you are going to do the race anyhow – only perhaps if you have sickness symptoms & want to use the HRV as a data point to help decide whether to take part or not. Resume normal measurements on the day after the event to gauge the extent of the damage & likely recovery time.
Simon Wegerif.