
by Carl Valle USATF II

The use of Heart Rate Variability (HRV) for sport is not new, but only after ithlete created a solution that was practical did we have something to truly act as a compass for coaching. Our coaching experience and knowledge is the roadmap, and while looking above at the stars for orientation is possible and resourceful, the invention of the HRV “compass” is an invaluable tool to direct training of athletes. HRV is gaining momentum, but like any current technology, it’s best to reflect on what has worked in the past to refine what we are doing now. At the end of the day interaction of all of the data we are collecting will lead us to better decision-making, and I hope to share some important factors to think about when integrating ithlete into a training program.
Over ten years ago Doug Laney suggested that the 3Vs of data, volume, variety, and velocity were primary components of the emerging trends with data management. His 3-D Data Management report, brought up again by IT and data visualization exert Stephen Few, is timeless with its principles and has much truth to what is happening today with big data. My experience with ithlete is that a consistent collection of HRV shares a similar philosophy. While only two of the three components are in agreement, having a sustainable data point over a season does create important stability.
No matter what happens during the year, one can always perform HRV testing, something that can’t be said with all tests in performance or sports medicine. To me HRV is a Key Performance Indicator as it summarizes the story of everything going on internally with the body. A vertical jump with a sprained ankle or a Yo Yo test in the middle of an NBA season is unlikely, so we need a combination of passive and active testing to get insight. ithlete allows for 2,500 data points a year or more, all of them having merit and the ability to have rich information each day.
Like Doug and Stephen, I have my own 3Vs on data and key principles in what factors make them valuable to coaches. My 3Vs are validity, value, and vector. HRV is more than proven to have scientific evidence in predicting performance and fatigue in sport, and sharing why it is helpful in health management. The value is that the data (or sometimes lack of data) demands a decision or action can be made immediately) hence the third element Vector. Vector to me is the most important, as it involves direction of where things are going. The word vector has so many meanings, but velocity to me is a double-edged sword, as speed without the right direction is dangerous.
I coach Track and Field (athletics) and I have some athletes use HRV to monitor training and the variables of life. The day-to-day indicator light from ithlete is something I respond to for two reasons. The first is the perception of readiness of the body. This is often right, but it’s never the deciding factor. The second reason I respond is perhaps more important, it engages both coach and athlete to see how one is feeling. Next to pain and general fatigue, HRV is great conversation piece because both coach and athlete have access to the same data. I like transparency, as even sensitive data becomes desensitized. When data points are aggregated and shared each morning, a simple motivational quote or phone call shows the athlete that you are using the data. Compliance is the number one challenge with data being collected by the athlete, and if they experience coaches being involved with it, they will value the collection process.
With vendors advertising big data everywhere, to me big data is not about how many terabytes one gets, but it’s about the big picture it can create with longitudinal collection. The benefit from mobile HRV is that it allows more athletes to test more often, and the time stamp is a crude indication of sleep hygiene and helps create a simple timeline.
Data visualization to me is about sharing a cause and effect so that anyone outside the field can read and interpret what the few can understand without it. We can all read the stock market rise and fall or interpret the weather on a map, and line charts can help paint a picture of where things are heading, where we are now, and what happened in the past. A quick scan with a few annotations can help communicate to both the athlete and other staff what is going on. In team sports the strength coach is unique and often works with everyone and needs a way to share informative data. Remember the sport many coaches are not formally educated in sport science.
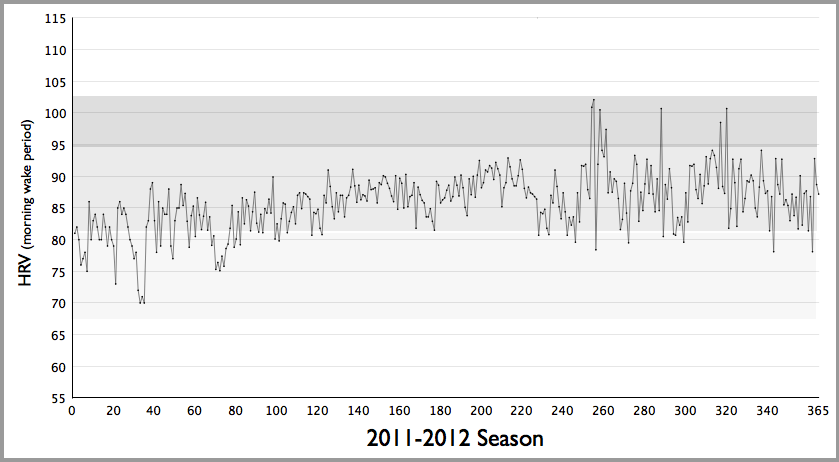
Stephen Few’s bandlines; simple areas of expected performance (dark region, and the areas of warning (light region) can be created by filtering the data. Without much data visualization, clear patterns emerge with just the raw scores can be seen without much interpretation.
Currently an interesting ecosystem is created with new ways to interpret annual data because the smartphone era in sport is now creating new innovations in viewing how athletes are responding biologically to training and the outside world. The pragmatic approach with apps is helping with questionnaires so they are reinvented with more interest to the athlete. Instead of a dull checklist, the questions are more personalized and are based on both objective and subjective feedback. The ithlete App has a comments suggestion that can lead to word clouds and other more powerful analytics options such as psychological algorithms and even injury predictions.
Combining HRV and more conventional data points is where we need to be. HRV in isolation is helpful, but without the underlying root issues and causes of the change, it is just objective RPE numbers. What we need to do is evaluate our own programs and see what is really happening, and when HRV is combined with biochemical tests, the explosion of useful data arises and often the drastic reduction of possible causes. At first, more data may be interpreted as more questions, but if used right it reduces the usual suspects by a cold process of elimination. So long as collecting data doesn’t interfere with the actions of solving the purpose of collecting it, coaches can make better choices and refine programs year to year.
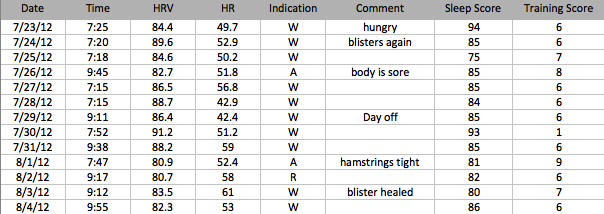
A simple table is a convenient method of drilling down to see more relationships when coaches sync their athlete’s files with their dropbox. The data above uses simple RPE and sleep scores based on ratings from the sensor market. Brief comments are extremely useful as it creates a mini log for athletes to reflect on what is going on with both body and mind.
Calibrating HRV to performance and medical data is tricky, as no research supports what is best practice and we are still infants here. I do think great performance and lack of injuries are the true benchmarks. Many have written and lectured about the fine line between overtraining and underpreparing, but I think we can start drilling down to more precision here with HRV and other technologies such as Tensiomyography (TMG). TMG and HRV are natural partners, with one sharing what is going on locally (TMG) and the other showing what is going on globally (HRV).
The use of HRV is a unique opportunity for sport professionals to monitor athletes without a huge investment, be it time, expense, or expertise. The future will be about making the process a better experience so the athlete is engaged year after year. The ithlete app’s additional features like resting heart rate, sleep score, training load and comments options can share a personal training log instantly while reinforcing to the athlete that he or she is responsible for his or her body. What is key are coaches doing the right things to enable athletes to invest into HRV testing daily.
Technically, velocity is already a vector in physics — it’s a measure of both speed and direction. Since “velocity” applied in other domains is a metaphor based on the physics term, I hope it should continue to be treated as a vector. So the case you make for “vector” instead of “velocity” in your 3 Vs is mistaken.
You are both wrong “technically speaking”, but with a metaphor I think the point is about speed without the right direction is meaningless in the world of computer science. Solving the problem quickly is pointless if you are not correct.
Good stuff, Carl.
great stuff Carl. Always a pleasure reading your insights.
Jeremy,
I think the concept of what Carl is trying to explain is more important in this case than the morphology of the words he is using. The concept is clear.
Given the momentum with HRV, a reflection like this is not only much appreciated but necessary.
Thanks for the kind words and suggestions from Jeremy. Perhaps you (Jeremy) could reread the blog and edit what you think would be a better paragraph for the website.
As for the purpose of the blog, my question to anyone who commented do you have a years worth of HRV and training to share? With every vendor talking about big data I barely see attendance and bodyfat % anymore.