Timeline
As well as a brand-new look the redesigned ithlete Pro Timeline boasts some great new features.
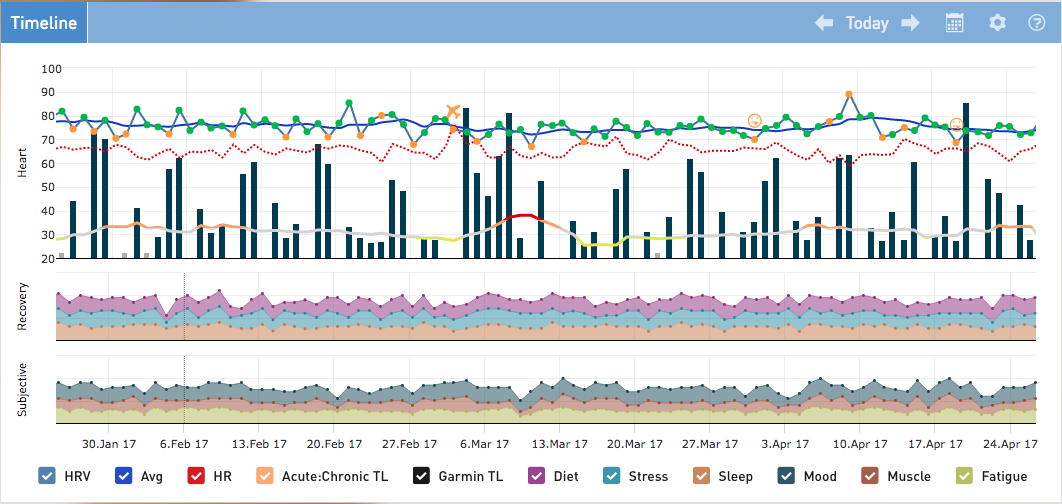
We have made it easier to understand the cause and effect relationship between your HRV, training and subjective metrics. We’ve also separated out the factors under your control that have a big impact on how quickly you recover. As well as regular trends, you can identify the most likely causes for when you get results you were not expecting. When you get an unexpected amber/red recommendation, or perhaps aren’t feeling confident in a ‘Go for it!’ take a look at the Timeline chart to see how your training, recovery and subjective trends have contributed to your current state.
Data you get play with
We’ve yet to meet someone who can’t learn something about themselves to improve health or fitness from regular HRV measurement and understanding the trends. Set your timescale to 1, 3, 6 or 12 months to scroll back through up to two years of ithlete data to visualise how you tend to cope with training, manage stress or recovery enablers and track your long-term trends. You can also zoom in on a data for a closer look or use the new calendar feature to quickly review a date in the past.
Flagging?
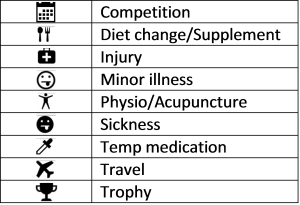
The add a flag feature has been present in ithlete Pro for some time, but perhaps a little hidden. So we’re using this opportunity to remind you that by clicking/tapping any data point on your Timeline chart a pop up will appear. From here you can edit data for that day and, importantly, add flags. Flags can help you quickly identify likely causes of HRV highs and lows when you look back at data. What’s more, if you’ve flagged dates, for example competitions, you can easily review how quickly your body normally recovers. Flags available include competition, illness, injury, travel and more.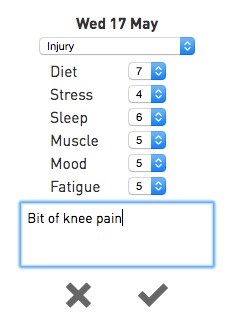
Acute to Chronic Training Load – how much is too much?
Gauging how much is too much whilst increasing training is a challenge for even the most experienced athlete. There is now a much more precise calculation than the old 10% rule called the Acute to Chronic ratio, as detailed in this Runner’s World article. The Acute to Chronic training ratio compares your training load for the last week to your average weekly training load for the last four weeks. We’ve done the maths from your imported training load and show your Acute to Chronic ratio with a colour coded line on the new ithlete Pro timeline. Anytime you see the line creeping into the red you want to consider reducing your load to reduce the chances of illness and injury. This is also part of the new International Olympic Committee recommendations on managing Total Load.
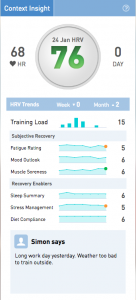
Context is key!
We’ve made an important upgrade to the Context Insight widget. Subjective and Recovery scores outside of your personal norm are colour coded to help you identify what is going well and areas for improvement. This will also help you understand what has contributed to your current score and readiness. There’s now more reason than ever to record these metrics as accurately and truthfully as you can, as these are the key to identifying what works for you and making it into a habit.