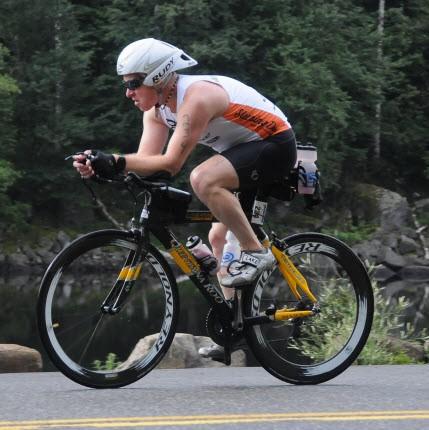
 I started the journey of triathlon about 9 years ago. I was 40 pounds overweight and could barely run a mile without having to walk. I was immediately drawn to triathlon due to the continuous learning and need to balance many things that it requires in order to succeed. It requires a lot of patience too. I had to re-learn how to run and swim properly in order to avoid injury and become more efficient. You will experiment with many different tips and techniques along the way as you progress in the sport. You adopt the ones that help and toss the rest aside.
9 years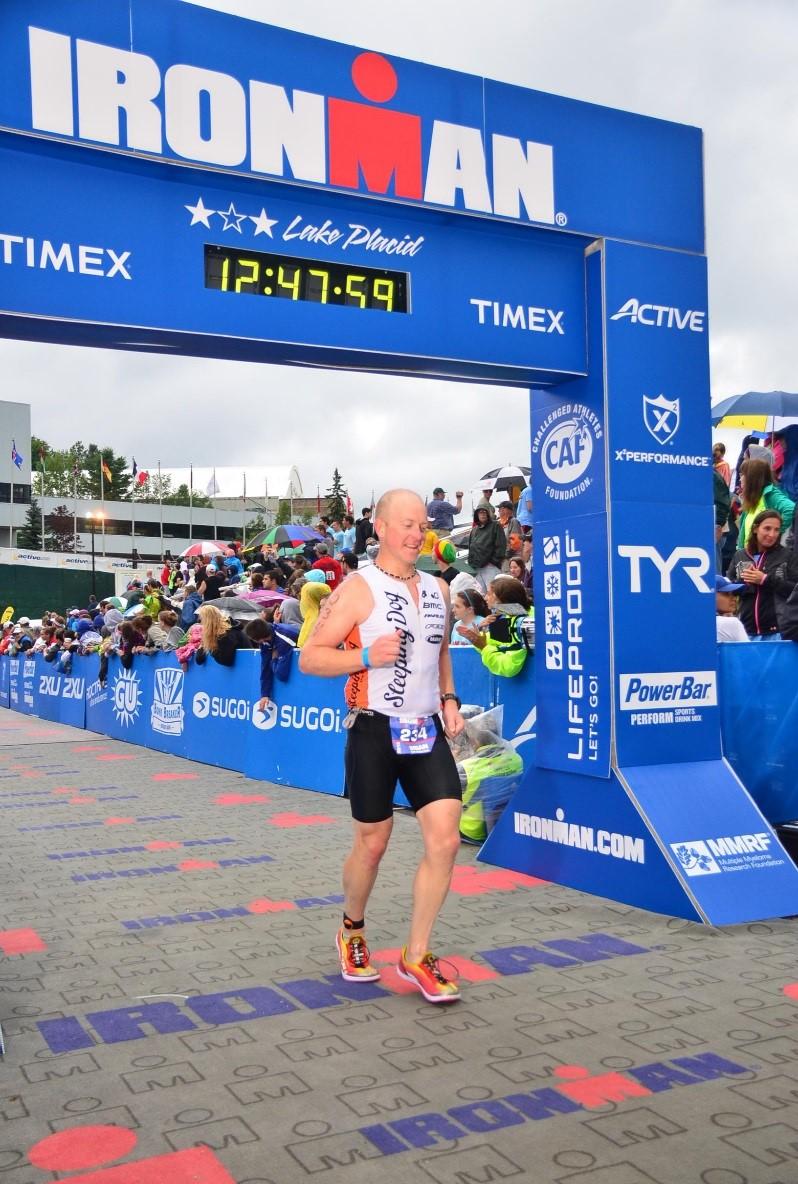 later I have completed 2 Ironman’s (Lake Placid), 7 half iron distance, a bunch of Olympic & sprint distance triathlons and am on my way to my third Ironman at Coeur d’Alene this June. I am not a fast, highly-gifted athlete and may never get to compete at Kona, but I have put in a lot of hard work and came out with sme results I am proud of. Just getting to the starting line of an Ironman in good race condition is 90% of the battle. One of the most important things I have learned in this sport is how to train smart and listen to my body. If you don’t, you may never get there or if you do it could be a very painful day
One tool I have been using for the last 3 years to measure how my body reacts to training and other stresses is Heart Rate Variability or HRV for short. HRV is determined by a calculation of the wave and frequency of your heart beats. This calculation can then determine the state of your Autonomic Nervous System (ANS). Your ANS is comprised of your Sympathetic and Parasympathetic branches and are responsible for controlling most of your bodily functions. This is why HRV makes such a great measure for determining your body’s reaction to external stressors.
Performing an HRV measurement is very easy with the use of a heart rate monitor and the ithlete mobile application. It only takes about a minute to perform first thing in the morning. The result that you typically get from the HRV measurement is a single value. If it is high, things are good. If it is low, then your body is stressed. Before I found ithlete, I used to manually log this data daily and then plot it on a spreadsheet chart. The ithlete mobile app and the ithlete Pro site provide a “Timeline” trend graph that automatically tracks this measurement along with Resting Heart Rate, training level and other more subjective stressors over time for you. You can also export the data to a text file if you still need to analyze using your own tools. Using this measurement you can then tailor your training appropriately in order to take advantage when your body is responding and avoid overtraining when it is not. If your HRV is trending low, then you need to back off and recover a bit. If it is trending up high, that is the time for those high intensity workouts.
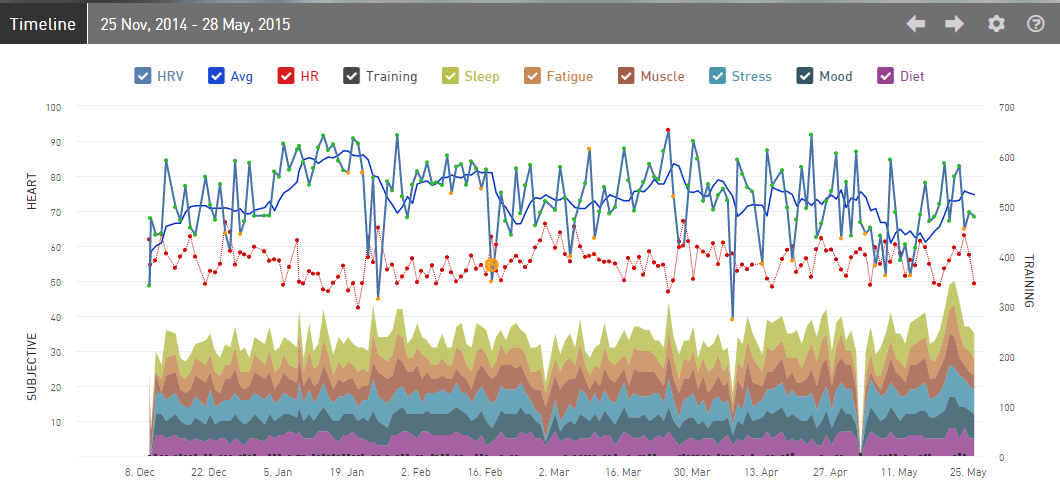
If you toggle off all of the measurements on the ithlete Pro Timeline chart, except for the HRV rolling average (chart below), you can see how my training during this season had affected my HRV measurements. This chart can provide a nice a high-level view of your HRV.
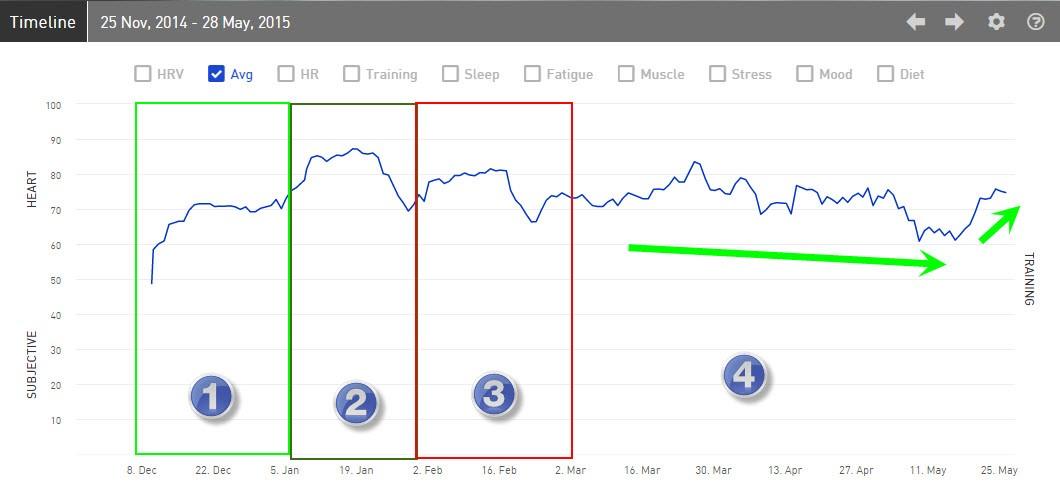
Section #1
This was my off-season and the start of my build phase. This was also the holiday season with a lot of parties along with eating and drinking. I did start training a bit during this time, which probably accounts for the initial upswing.
Section #2
This was the start of the New Year. Training continued to increase a bit, but my diet was restored to only eating healthy, whole foods again. I also had given up alcohol entirely after the New Year. You can see how HRV responded and moved up into the high 80-90 range.
Section #3
I am still maintaining a healthy diet without alcohol during this phase. I had also lost about 18-20 pounds of off-season weight during that time in sections 1 & 2. Training volume and intensity had also increased a bit in February which I believe accounts for a slight drop in HRV. It is still averaging mostly around 80 until the end of the month.
Section #4
For the months of March, April and May, training volume and intensity has increased pretty steadily. This is my build phase as I head into my “A” race at Ironman Cour d’Alene on June 28th. You can see a gradual decline in my HRV average which bottoms out around the last week of May. I also had my first race of the year, the NJ Devilman Half, during the first weekend of May. The effects of this hot and fast race are very pronounced and show a sharp drop the week that follows. I definitely put everything I had into that race and was quite exhausted the week after. I was able to recover properly by using my daily HRV measurement and performing more active recovery workouts which brought my HRV back up in the last week.
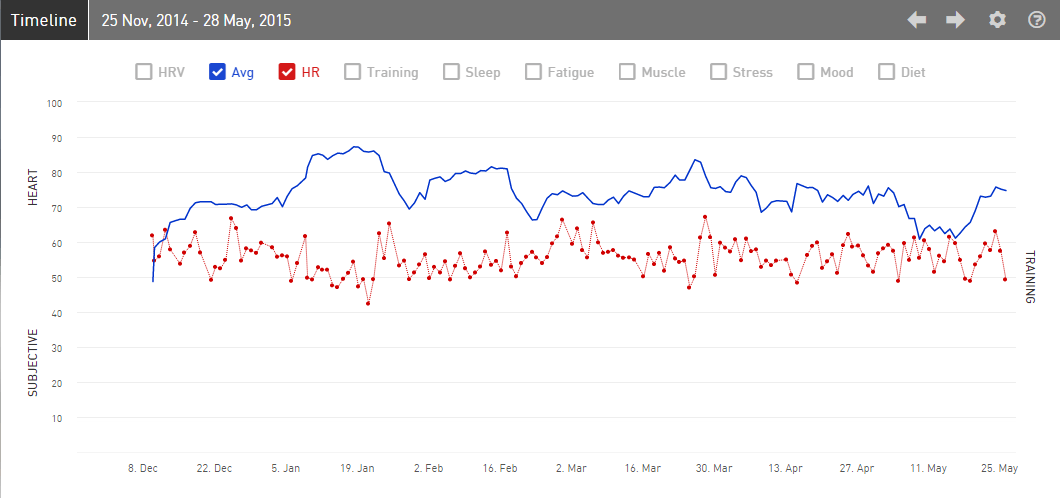
Resting Heart Rate (RHR) had previously been the de-facto measurement for trying to determine how your body responds to training and avoiding overtraining. As you can see in the graph above, my RHR trend really didn’t change all that much compared to my HRV measurement. This is another reason why HRV is a much more accurate indicator of training stress.
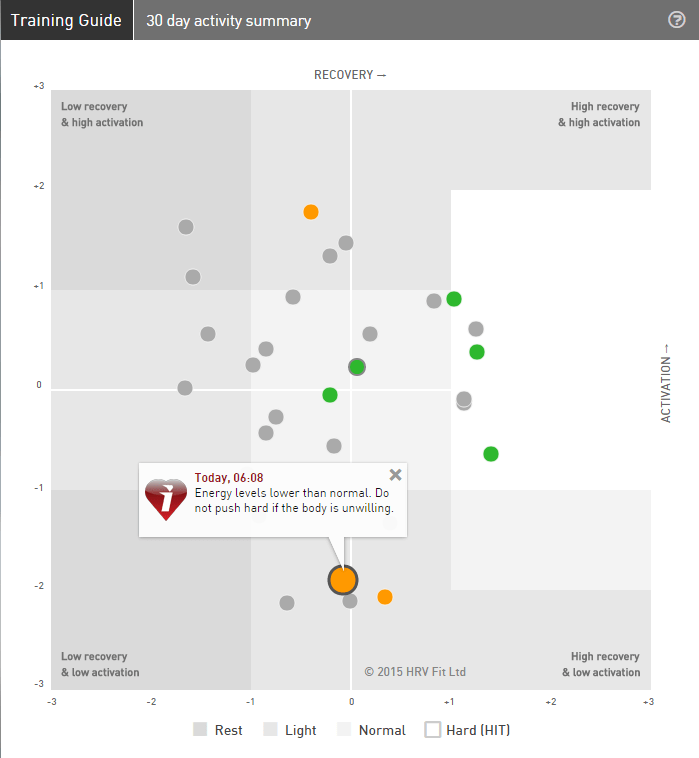
One of the most significant ways I think that iThlete Pro outpaces all the other HRV applications out there is through their Training Guide. The Training Guide chart plots your daily measurement on a X-Y axis graph based on Activation and Recovery. Each measurement falls into an area that determines how you should train that day, based on where your measurement falls. The basic idea is the lighter the shade of the area the better. This chart makes things fairly easy for day to day training. The graph also provides a little pop-up for each data point that tells you about where your measurement fell and what you should do for the day.
The Training Guide is also very accurate. I have had days where I was sick and it actually said “You are Sick…” in the pop-up guidance. I use this guide on a daily basis to tailor my workouts. I do create a forecasted training schedule, but have no problem adjusting things if my body is telling me to do something different. I am happy to say that I have been able to train successfully for 3 Ironmans’ now and a number of other races without injury or overtraining. I credit a lot of this to my daily HRV measurement and analysis. The addition of the ithlete application and their suite of analysis tools provides a more improved and faster method for utilizing this data. No longer do I have to manually log and chart this data. I take a 1 minute measurement in the morning and then jump on to the ithlete Pro site while drinking my morning smoothie and I can plan my training for the day.
I hope this provides some helpful tips from how I use HRV in my daily training. Over the next couple months I hope to dive into some more of the details of how I analyze HRV, how I act upon those readings and how other stressors affect it.
Profile

I am a plant-based, age group triathlete attempting to reach my goal of a sub-12 hour Ironman. I am an IT Professional by trade with some background in Business Intelligence and enjoy analyzing all my training data to glean some helpful information from it. You can find more about me on my blog, Instagram, Facebook, and Twitter.