
Who, what & why?
Athletes and their coaches are always looking for reliable, convenient ways to monitor how well their training is going and what performance gains its producing. Whilst we know that HR and heart rate variability (HRV) measures taken first thing in the morning are affected by training programmes, what measures can we use and what should we look for to be effectively monitoring adaptation?
A few of the best-known sports science researchers working on HRV in endurance sports wrote a useful paper that goes into this in some detail, and surprisingly, we have not summarised it before, so we are going to change that right now!
Whilst analysing data from a study we have previously summarised on an overtrained triathlete these researchers found that the weekly averages of HRV and resting HR were providing more robust signs of the overreaching that affected the subject of that study than the daily values.
What did they do?
They then decided to re-look at HRV data they had gathered during the 9 weeks of training preceding a 10k race for 10 recreational runners. They used statistical techniques including correlations and effect sizes to analyse resting heart rate (RHR) and HRV (LnRMSSD, as used in ithlete) both once-a-week daily values and 7d rolling (weekly) averages taken from first thing in the morning measures.
What did they find?
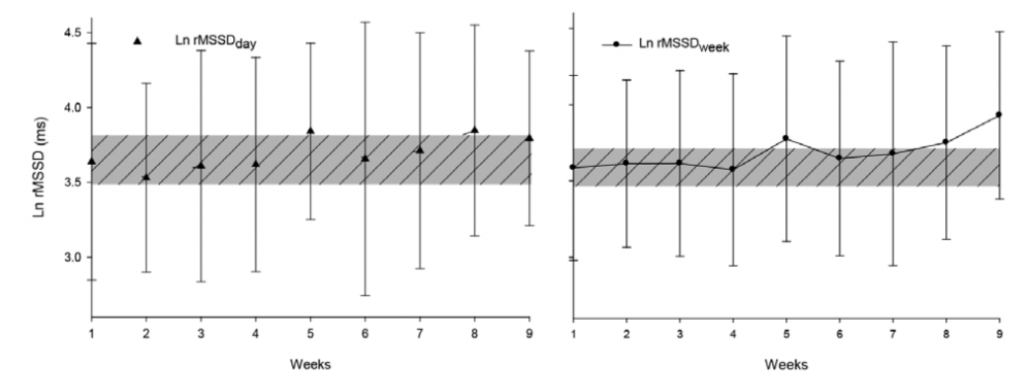
The overall pattern in resting heart rate was similar between the daily and weekly average figures, and showed a downward trend that signifies good adaptation.
On the other hand, the pattern in the weekly averaged HRV values was much clearer than the daily ones, showing a more pronounced rise at the end of the training period prior to the race:
To look at the relationship between changes in HRV from the beginning to the end of the training program vs improvement in performance, they plotted change in 10km time as a percentage vs change in HRV (also as a percentage). This was done for both daily HRV (one reading a week) and the weekly average:
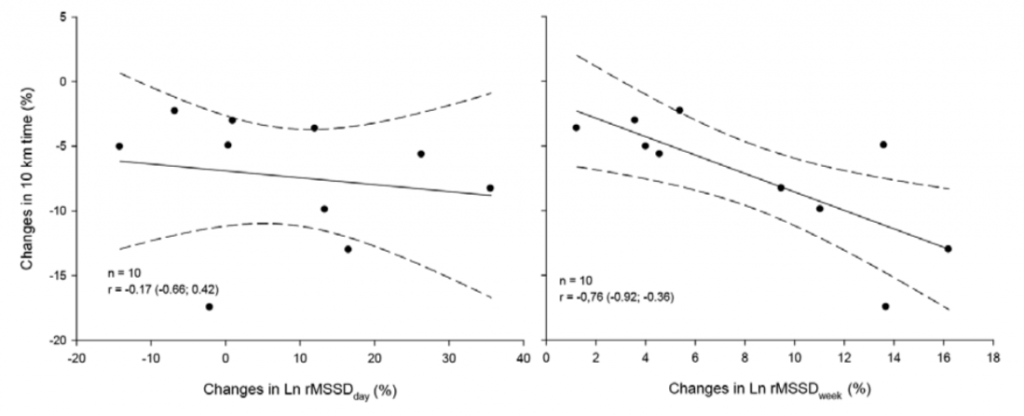
These plots clearly show that the weekly average was a much better measure for demonstrating the relationship and predicting improvements in running time from changes in HRV.
Practical takeaways
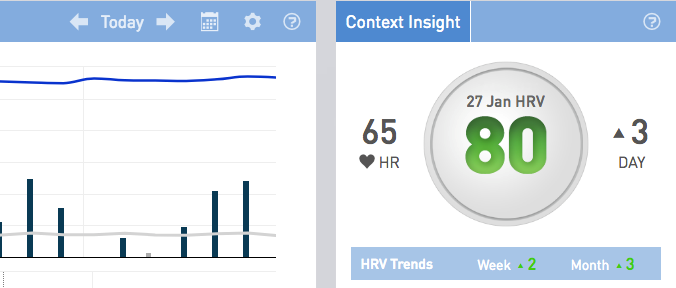
Both with negative changes in HRV as well as positive, the Weekly average is the one to use to detect how well your training program is going. It is this baseline trend which has been repeatedly shown to represent change in fitness. In ithlete the blue baseline shows your weekly rolling average, and the trends in it are automatically calculated and colour coded for you as the Week HRV Trend indications:
Using the data from this study as an example, a 10% increase in weekly averaged HRV predicted a 7% improvement in 10 km time. Making this concrete, if the ithlete baseline went from 75 at the start of a training program to 83 at the end of the taper, 10k running time would improve about 3.5 mins. Of course, this was a specific group and this exact same formula won’t apply to everyone, but it does show that changes in HRV weekly average baseline can be a very useful predictor both of positive gains from training as well as avoiding the dangers of overreaching. Win-win!
Evaluating Training Adaptation with Heart-Rate Measures: A Methodological Comparison
Daniel J. Plews, Paul B. Laursen, Andrew E. Kilding, and Martin Buchheit
International Journal of Sports Physiology and Performance, 2013, 8, 688-691
Interesting, thanks for the blog post.
My only concern would be: both look pretty similar until week 8. Is the result for week 9 really a significant trend or just random and possible reversed in week 10? What if the study had ended with only 8 weeks? How do the inidividual data for the 10 subjects look like?
Wondering if you might have asked the authors for the experiment data as the paper doesn’t reveal much.
Thanks Takura-san, I think that is a fair comment. If you look closely at the shaded band (smallest worthwhile change, SWC), it is narrower for the weekly averaged data, allowing significant changes to emerge more clearly, but this indeed only happens for week 9 (which is the taper week). To my engineer’s mind, this is the consequence of the moving average acting as a low pass filter, reducing the high frequency noise of the daily readings. This is a double edged sword though, since a low pass filter also takes longer to respond to a step change (such as a sudden degradation of health). Although we don’t have the individual data points, these are shown for the performance changes, where the association between HRV and 10 km time is much stronger for the weekly measure.
So, at ithlete, we think that reporting both daily and weekly change values is most appropriate, combined with colour coded assessments of significant changes.