
 After 6 long months the time to taper for Ironman Coeur d’Allene 2015 has finally arrived. I have developed a bit of a love-hate relationship with tapering over the last 3-4 years, as many others probably do. On the one hand it is nice to finally get a break after some pretty long, hard training weeks with temperatures moving upward. But on the other hand, there is usually a general feeling of malaise the first week or two as your body begins to rebuild itself. This sometimes can even bring about some illness too if you don’t prepare yourself nutritionally. By the third week you are starting to feel like Superman, but you really need to hold back since this week is key to not really exert yourself before race day. You feel like a lion in cage sometimes.
I have been monitoring Heart Rate Variability (HRV) during all three of my Ironman seasons and it is always helpful and interesting to watch this rebuilding illustrated through my readings. For instance, HRV can show you how maybe that little extra effort you put in during what was supposed to be a zone 2 run, may have hindered your recovery a bit. Also, things like travel, stress, pre-race anxiety and nutrition can also hinder your recovery. HRV is a great way to monitor that recovery on an ongoing basis and take steps to resolve those issues before they become bigger problems on race day.
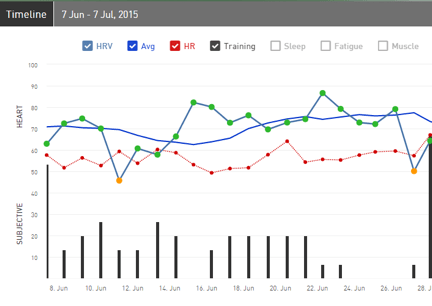
As you can see, the first 3 days of week 1 my HRV immediately shot up a little bit. I did really feel quite well on those days and had a great ride on Wednesday night (4th data point). I probably also went a little too hard which may have affected the very low reading (1st yellow dot) on Thursday. It is hard to say if it was from going to hard on the bike the night before or just imminent from tapering altogether. From that point on my HRV climbed steadily through the week and maxing out in the mid-80’s by the start of week 2. Week 2 sort of dropped a bit, this may have been from work stress prior to leaving for Ironman “vacation” and trying to tidy things up before I was out of the office. The reason I deduced this was that it went back into the 80’s again on the weekend. There is a reason we say “TGIF!” right?
Week 3 or race week my HRV also dropped down into the 70’s again. Here too I worked the first couple days of the week before I flew out to Idaho on Thursday morning (June 25th). Once traveling was done and I was settled in for the race I did get another reading in the 80’s. I am struggling to understand the really low reading the day before the race. I slept well, but perhaps pre-race anxiety was starting to come in to play here. The Pacific Northwest was experiencing an unusual heatwave during this time and the forecasted temperature for race day was expected to be 107 degrees Fahrenheit. On race day I had to get up around 3am since we were starting the swim at 5:30am to try to beat the heat. I can guarantee a lower reading anytime I have to get up that early, especially before an Ironman event!
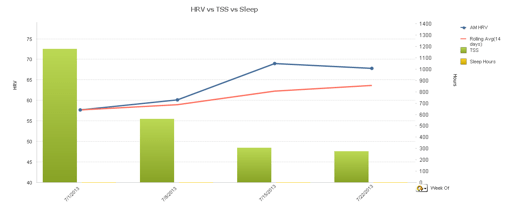
Looking at the HRV average trend (solid blue line) you can see the general increase in trend. This demonstrates pretty well the tapering affect via HRV. You would expect to see a bit of a dip in the beginning followed by a steadily increase up until race day. The more that line increases the better your recovery. If that early dip rebounds quicker into the 80-90’s then maybe you recover quicker and could possible shorten your taper a bit. Or if it is slower to recover than maybe you need to give yourself more time, sleep more and /or train a little less. Bottom line is that HRV is such a great tool to quantify your recovery during your taper.
HRV vs TSS Sleep During Taper
The graph below shows the correlation between my average HRV and my Training Stress Score® (TSS) and total hours of sleep during each week of my taper before Ironman Coeur d’Alene 2015. Thanks to the handy data export feature of the ithlete Pro Dashboard I can easily export my HRV data and match it up with data from other sources. Here I have matched the HRV data with my TSS values from Training Peaks and my sleep data from Beddit into a tool called QlikView. QlikView allows you to easily join data from disparate sources and has a free personal edition.
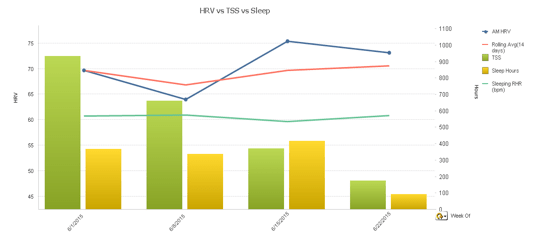
I have grouped the data by week. The first week is actually my last full training before tapering. You can see the step down in each week in my TSS score, which combines the training volume and also intensity. My sleep data looks pretty good except for the week before my race. If you figure a good week of sleep should be around 49-56 hours total (7-8hrs x 7 nights), then I was right on track. Taper week two was the best at around 56-57 hours. Race week suffered a bit sleep-wise with some early mornings for our flight to Idaho at 6:30am and an early 5:30am start time for Ironman. Getting up at 3am both days perhaps this played into that sharp drop the day before the race.
Both HRV trends, weekly average and rolling 14 day average, follow that general curve that we want to see for a taper. I would have liked to see that last week go a little higher, but that is the effect a destination race can have when traveling across time zones.
Historical HRV Comparisons
I thought it would be interesting also to look back at my previous two Ironman taper periods in relation to this year. The HRV reading in those prior seasons were done using a different HRV application, which may lead to this not being a true apple-to-apple comparison, but I would expect to see a similar trend. The application I had used back then did not have any data export feature, so I had to enter each day manually into a spreadsheet, which was how I started using an external application for graphing.
Ironman Lake Placid 2014 Taper
Last year things trended a bit differently. My HRV actually increased during taper week 1 and then dropped during the second week. It partially rebounded during race week, but not too high. Unfortunately I did not have any sleep data to compare back then.
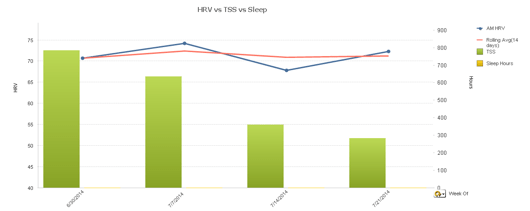
Ironman Lake Placid 2013 Taper
In 2013 my HRV trend during my taper looks a little more typical. It was pretty low coming off my last big volume-training week and only slightly increased during week 1 of the taper. Week 2 shows some significant recovery and week 2 stayed fairly the same. This taper follows a little more closely with this years’ trend. Week 3 tapers tend to drop a bit I notice, which could be due to the stress and anxiety of the events leading up to the big race.
As you can see, HRV is a great tool for analyzing your taper before a race. Knowing what to expect can help you manage that from day-to-day during the taper phase and eradicate any issues. Once you develop a history of these patterns you can match them up with your good and bad races and build a better personal knowledge base for taper. This is where experience comes into play.
I hope this was helpful too anyone monitoring HRV and getting ready to taper before a big race. Obviously shorter distance races are going to be a little tougher to manage since they are not quite as long and don’t have as much data. Next month, I will look at HRV and the effects of racing an Ironman event in temperatures over 100+ degrees(F). We will also look at how it can be used to check your recovery so you can get back to training for that next late season race.
Training Stress Score® (TSS) is a registered trademarks of Peaksware, LLC
Profile

I am a plant-based, age group triathlete attempting to reach my goal of a sub-12 hour Ironman. I am an IT Professional by trade with some background in Business Intelligence and enjoy analyzing all my training data to glean some helpful information from it. You can find more about me on my blog, Instagram, Facebook, and Twitter.