There are many great reasons to choose ithlete, so many that we’ve written a blog series looking at why we do things the way we do. Follow the series to learn more about the type and length of measurement, how breathing influences your HRV and much more.
The ithlete colour coding system
When you start using ithlete you will soon see a thick blue line appear on your chart. This is your personal ithlete HRV baseline, a 7-day average of your daily readings. Used since the first prototypes of ithlete 10 years ago, this individual baseline is used to identify significant changes. It has stood the test of time and has been validated as best practice in this review by Plews (2013).
Identifying normal & abnormal daily readings
Each morning when you take your ithlete HRV, the result is compared with the baseline to determine whether it falls within your normal range. The range is set at a statistic known as the standard deviation for the purposes of traffic light guidance.
- Approximately two thirds of all your readings will be within this normal range shown with a green training recommendation.
- If a reading is more than 1 standard deviation below your baseline, it is marked as an amber warning. This is not necessarily a reason to stop training – it just makes you aware that you are not fully recovered.
- If as well as your daily HRV being low, your resting heart rate is unusually high, then ithlete gives a red warning. This indicates that your body is stressed, possibly by illness, and you need to give it a chance to recover.
What about abnormally high HRV?
As well as colour coding HRV values below normal for the user, ithlete also highlights HRV values significantly above baseline. These readings can be a sign of possible adrenal fatigue, especially when combined with abnormally low resting HR. You may have experienced this when you go for a workout and simply cannot raise your heart rate, pace or intensity to the level you want. This blog article explains more about the relationship between high HRV and fatigue.
Identifying normal & abnormal trends
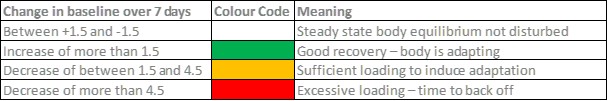
As well as the daily HRV recommendations, ithlete colour codes your HRV trends in a unique way based on published research into overtraining. In a study by V. Pichot et al (2002), HRV response to progressive overload in runners was studied. Their findings are used in the ithlete weekly and monthly change indications to flag when overload may become unproductive (i.e. excessive and difficult to recover from). You can see these indications in the ithlete mobile app, shown with amber and red colouring of the symbols next to the Week and Month change numbers. Conversely, during taper (the period at the end of a training block when loading is reduced) and rest periods, beneficial upwards trends are flagged green.
Many Coaches and HRV experts regard the Week change as the key one for identifying how far to go in periodised training before backing off. The following table summarises this:
In summary
ithlete colour codes both daily changes and trends in HRV to give comprehensive feedback on how your body is being affected by, and recovering from stress – whether that is induced by training, or equally important, lifestyle factors.