
The ithlete Pro™ Training Guide is a unique new chart showing your current physical state in two dimensions, recovery and activation, and is the next focus of our Tuesday Tips series.
Recovery and Activation
The Training Guide goes beyond a single score to tell you not only how recovered you are, but also how activated or energized your body currently is.
The horizontal dimension, Recovery, is your heart rate variability (HRV) score compared to a 30 day average, with higher scores towards the right.
The vertical dimension, Activation, is also derived from your HRV measurement and shows to what degree your nervous system is currently activated, with higher activation towards the top of the chart.
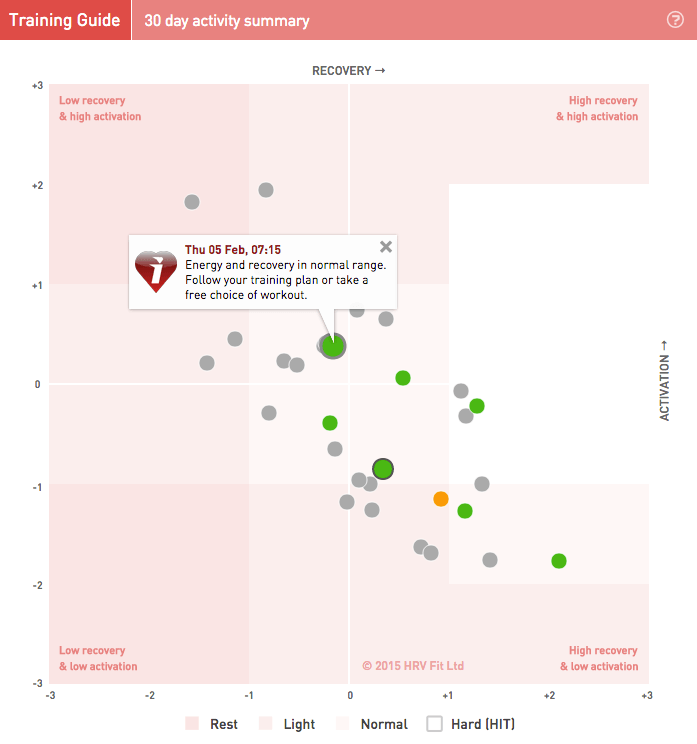
The ithlete Pro™ Training Guide Chart zones & bubbles
The ithlete Pro™ Training Guide chart is marked in zones to help you decide the best kind of training to perform based on your current state. It goes beyond existing timeline charts and traffic light indicators to show you precisely where you are compared your normal range over the past 30 days.
The coloured bubbles represent your readings for the past week, and older readings are shown in grey. Today’s and yesterday’s readings have a dark halo for easier identification.
The positions of the zones and bubbles are determined using a statistical technique called Z-scoring*.
The ithlete Pro™ Training Guide Zones and what they mean:
Normal range
The centre of the chart is your normal state and the light shaded area around it your normal range. If your score is in this range, feel free to follow your training plan or do whatever workout you would normally be able to perform on an average day.
HIT
As we move to the right of the centre, we get into the high intensity training (HIT) zone. You are more recovered than usual, and you have more reserves to draw upon. These are good days to perform the more demanding workouts in your schedule, including the short sharp intervals, HIT and speed sessions.
Calm – low Activation
Below the HIT zone, your Activation level progressively reduces, so you might not feel sufficiently energized to perform intensive reps, and at the extreme bottom right it’s likely you would feel little energy or enthusiasm. If it persists for several days, this state can eventually become adrenal fatigue, which requires rest and special attention to your diet to recover from quickly.
Stress – overreached
Towards the top left your system is activated or energized but your recovery or reserves are low. It’s good to be energized for sure, but excessive and continuous activation is a stress state. The analogy often used is that people evolved a fight or flight response to catch prey or run away from danger, but when this response is chronically activated it leads to stress. You can expect to be in the top left corner when stressed e.g. by illness, tough work situations etc. or whilst overreaching in your training.
Whilst your body is continually stressed you need to back off from intensive exercise, but low intensity aerobic exercise and a good diet is likely to accelerate recovery (active recovery).
Tired / burnout
Low recovery and low activation at the bottom left corner is a lack-lustre state where you may be feeling burned out. Rest is strongly advised.
Summary
As well as the zone shading, a single sentence summary gives you training advice in a nutshell. The ithlete Pro™ Training Guide is an interactive tool, so clicking or touching on any of the points will bring up the date and training advice given on that day.
From time to time you will see the Training Guide provides different feedback to the 3 colour traffic lights of the ithlete mobile app. The reason for this is that whilst the traffic lights are based on a 7 day moving average, the Training Guide is based on a 30 day evaluation, so it uses more data and gives a continuously varying position rather than putting hard boundaries on your state. You can also think of the Training Guide as taking into account the Weekly and Monthly change indicators of the ithlete app to give a richer overall picture.
Overall, remember that training is all about stress and recovery, so don’t be surprised or concerned if your scores go out of the normal range for a short while, just bear in mind your particular recovery needs which you will learn about by using ithlete every day and monitoring your lifestyle factors to see which ones have the most influence.
* Z – standardized scoring
Z-scoring is a popular technique used by investors and other professional analysts to visualize whether a particular score is typical or unusual in a group of numbers, and if unusual, how unusual is it.
A Z-score of 0 means you are right on your normal value, and positive & negative values tell you if you are above or below the normal and by how many standard deviations. Z-scores are nearly always in the range +3 to -3.
The revolutionary heart rate variability (HRV) tool ithlete Pro is a cloud based solution delivering a more comprehensive view of your training, recovery and lifestyle data. Read more and sign up for a two week free trial here.
In case you missed it last week we took a look at Using the ithlete Pro Timeline as a first post in this series. Don’t forget to follow ithlete on Facebook or Twitter to see the rest of the series!
Please see also Bike Envy’s excellent in depth article on using ithlete Pro here:
Bike Envy ithlete Pro review
What exactly is activation?
How is it measured from HRV recording?
Hi Diana,
Thanks for the question. The way the values are calculated is explained in this article as well as the in depth Bike Envy article linked from the comment:
http://www.myithlete.com/tuesday-tip-ithlete-pro-training-guide/
what is training score? Is it the same at TSS in trainingpeaks? And, I am sync’d with training peaks and garmin connect but no reading from ithlete are showing up in either app. Is the sync really just ithlete gathering information from those apps and adding it in to algorhythm to assist with HRV and dashboard info in ithlete?
Hi Mark,
The training score is dependent on the input – if you enter it manually it can be any scale you choose, if synced to Garmin Connect it will import TRIMP, and if using TrainingPeaks then it is TSS.
In addition, you can upload your ithlete data (HR, Comments, Fatigue, Mood, Muscle, and Stress) to your Training Peaks account too.